Answering your questions
‘How are maps created in the lab?’
Site Maps, Plans, and Profiles
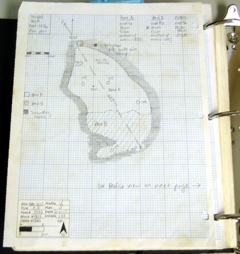
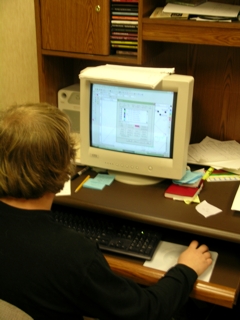
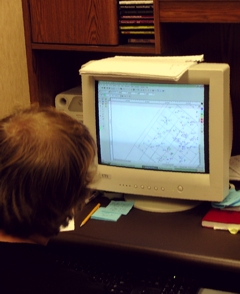
 My name is Jamie Barrow and my job at Southern Research is that of Graphic Specialist. I mainly specialize in computer aided drafting, or CAD. I produce many of the site maps for the company. There are several ways in which I do this. The first, and most common, way is by taking a site map drawn in the field, scanning it into a CAD program and then tracing it. DesignCAD, the program I use the most, utilizes layers. I put the scanned image on one layer and on another layer I draw lines that correspond to the lines on the hand-drawn site map. Then I turn off the layer with the scanned site map and all that can be seen is the map I produced on the computer. The map is then printed or saved for use in a report. This method is also used (especially at the Leake Site) to create plan and profile drawings of excavated features and test units.
The second, and most rarely used, technique I employ to make maps is by scanning in aerial photos and tracing physical features visible from the air. This method isn't the most accurate. However, it comes in handy when previous excavations at a site haven't been tied into a known datum or the datum information is lost. A datum is a recorded point that has an absolute location that is used to tie in the location of everything on a map. With an aerial photo of a previous excavation I can use unchanged landmarks on the photo, such as buildings and roadways, to tie in the previous excavations with our excavations.
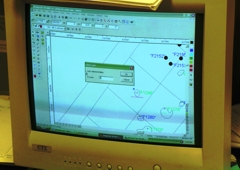
The third technique, which was used to document the Leake Site, is surveying the site using a Total Station Laser Transit. This is a machine that is set up on a datum. The laser transit I use is a TOPCON GTS-313. When prompted, it shoots a laser into a prism placed on top of a pole. The prism reflects the laser back to the total station and the exact spacial location of the base of the pole is recorded on a data collector. The data collector, connected to the transit by a wire, is about the size of a calculator and can be operated independently of the transit to edit data. The points that I shoot in are recorded on the data collector and assigned a field site number, which designates the order in which the points were shot in, and a title that describes what the point is. The point is recorded with a North and East coordinate as well as an elevation. This allows us to know where that specific point is in all three dimensions. We have recorded more than three thousand points already at the Leake Site. After all these points are shot in at the site, I return to the lab where the data is transferred to a file on the computer. After formatting, the file is imported into Design CAD with the field site number, the point coordinates, the point titles and the point elevations all on separate layers. Then, on a new layer I connect the dots of points that designate excavation boundaries.
At the Leake Site, a nail was put into every feature (a dark stain in exposed soil) these nails account for most of the points that were shot in with the total station. These nails were also drawn into the feature drawings made by the field crew. They essentially act as mini-datums. Next, I take my traced drawing of a feature form, copy it into the overall map of the Leake Site, and line up the two nail points to place the feature in its exact position in the excavation. This process is initially used for larger, irregularly shaped features. Round features that are probable post molds (perhaps indicating a structure of some sort) are initially assigned a black dot of the same size as the post. Then, after analysis of the feature forms, the dots are arranged on different layers depending on whether they are legitimate features or non-cultural stains, such as roots or animal burrows. Finally, a map showing only legitimate features is created. It is then scrutinized for structural patterns in stains that may or may not denote ancient settlements.